Understand metrics for Exadata Storage Server is important to understand how all the software features are being used and all the details from that. Here I will discuss one case where the FC_IO_BY_R_SEC metric can show not precise values. And I will discuss one missing metric that can save a lot.
If you have doubts about metrics, you can check my post about metrics, it was an introduction, but cover some aspects of how to read and use it. You can check my other post where I show how to use metric DB_FC_IO_BY_SEC to identify database problems that can be hidden when checking only from the database side.
Metrics collection
For this post, all metrics were collected from one storage server, but the behavior occurs in all cells from Exadata, and in all versions. And they were collected using the same timestamp be accurate. So, they represent one minute, but again, the same behavior that I show here occurs every time. When reading the metrics, please look at the metric name and the collect moment.
The idea for this post came when I was investigating storage usage from one database to see if we are hitting the limits for Exadata Storage. I needed to check disk, flash cache, and other details. For the behavior I show below, I already worked with Oracle about (SR, BUG, ER).
DB_FC_IO_BY_SEC
I already discussed about this metric in a previous post, but its report (according to the official doc) the “The number of megabytes of I/O per second for this database to flash cache”. Look the usage for the database DBPR1_EXA:
CellCLI> list metrichistory where collectionTime > '2019-12-13T15:42:00+01:00' and collectionTime < '2019-12-13T15:43:00+01:00'
and name = 'DB_FC_IO_BY_SEC' and metricObjectName like 'DBPR1_EXA'
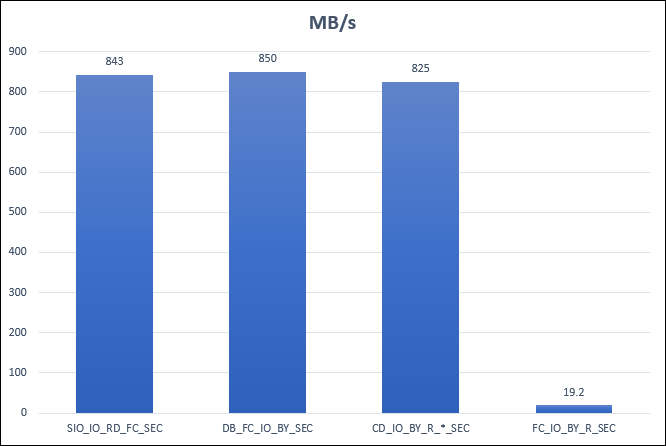
DB_FC_IO_BY_SEC DBPR1_EXA 850 MB/sec 2019-12-13T15:42:03+01:00
CellCLI>
As you can see, at 15:42:03 of 2019-12-13 the storage server reported that during the last minute this database made around 850 MB/s of reading from flash cache.
And this was the highest database consumption (that used more than 0.5 MB/s):
CellCLI> list metrichistory where collectionTime > '2019-12-13T15:42:00+01:00' and collectionTime < '2019-12-13T15:43:00+01:00'
and name like 'DB_.*BY.*SEC' and metricvalue > 0.5
         DB_FC_IO_BY_SEC         ORADB01P                1 MB/sec        2019-12-13T15:42:03+01:00
         DB_FC_IO_BY_SEC         ORADB02P                7 MB/sec        2019-12-13T15:42:03+01:00
         DB_FC_IO_BY_SEC         ORADB01V                1 MB/sec        2019-12-13T15:42:03+01:00
         DB_FC_IO_BY_SEC         ORADB03P                5 MB/sec        2019-12-13T15:42:03+01:00
         DB_FC_IO_BY_SEC         ORAD01P                 6 MB/sec        2019-12-13T15:42:03+01:00
         DB_FC_IO_BY_SEC         ORADBPR_EXA             2 MB/sec        2019-12-13T15:42:03+01:00
         DB_FC_IO_BY_SEC         DBPR1_EXA               850 MB/sec      2019-12-13T15:42:03+01:00
         DB_FC_IO_BY_SEC         DBP01                   104 MB/sec      2019-12-13T15:42:03+01:00
         DB_FD_IO_BY_SEC         ORADB01P                1 MB/sec        2019-12-13T15:42:03+01:00
         DB_FD_IO_BY_SEC         ORADB02P                7 MB/sec        2019-12-13T15:42:03+01:00
         DB_FD_IO_BY_SEC         ORADB01V                1 MB/sec        2019-12-13T15:42:03+01:00
         DB_FD_IO_BY_SEC         ORADB03P                5 MB/sec        2019-12-13T15:42:03+01:00
         DB_FD_IO_BY_SEC         ORAD01P                 6 MB/sec        2019-12-13T15:42:03+01:00
         DB_FD_IO_BY_SEC         ORADBPR_EXA             2 MB/sec        2019-12-13T15:42:03+01:00
         DB_FD_IO_BY_SEC         DBPR1_EXA               850 MB/sec      2019-12-13T15:42:03+01:00
         DB_FD_IO_BY_SEC         DBP01                   105 MB/sec      2019-12-13T15:42:03+01:00
         DB_FD_IO_BY_SEC         _OTHER_DATABASE_        1 MB/sec        2019-12-13T15:42:03+01:00
         DB_FL_IO_BY_SEC         DBP01                   1.150 MB/sec    2019-12-13T15:42:03+01:00
         DB_IO_BY_SEC            ORAD01P                 2 MB/sec        2019-12-13T15:42:03+01:00
         DB_IO_BY_SEC            ORADB1P_EXA             1 MB/sec        2019-12-13T15:42:03+01:00
         DB_IO_BY_SEC            DBP01                   2 MB/sec        2019-12-13T15:42:03+01:00

CellCLI>
If I sum all the database usage from flash cache, it will be around 950 MB/s.
FC_IO_BY_R_SEC
Since DB_FC_IO_BY_SEC reported just a small usage, I went to check the metric for the whole flash cache. So, I went to FC_IO_BY_R_SEC since this metric report (according to the docs): “The number of megabytes read per second from flash cache”. And since we are reading the metrics for flash cache direct, it report the number for all databases.
But, look at the numbers:
CellCLI> list metrichistory where collectionTime > '2019-12-13T15:42:00+01:00' and collectionTime < '2019-12-13T15:43:00+01:00'
and name = 'FC_IO_BY_R_SEC';
         FC_IO_BY_R_SEC  FLASHCACHE      19.343 MB/sec   2019-12-13T15:42:03+01:00

CellCLI>
So, at the same time moment that one database metric reported around 850 MB/s from FC reading, the metrics from FC reported around 19 MB/s. Something it is not correct.
And even if I check the minute before and after (because maybe was a glimpse of time collection) the numbers are not quite different:
CellCLI> list metrichistory where collectionTime > '2019-12-13T15:41:00+01:00' and collectionTime < '2019-12-13T15:44:00+01:00'
and name = 'FC_IO_BY_R_SEC';
         FC_IO_BY_R_SEC  FLASHCACHE      27.519 MB/sec   2019-12-13T15:41:03+01:00
         FC_IO_BY_R_SEC  FLASHCACHE      19.343 MB/sec   2019-12-13T15:42:03+01:00
         FC_IO_BY_R_SEC  FLASHCACHE      39.600 MB/sec   2019-12-13T15:43:03+01:00

CellCLI>
Others flash metrics
So, since the numbers appear to be completely wrong I searched for other metrics that report flash usage (disks and flash cache as an example).
CD_IO_BY_*_*_SEC
I started to search with the lowest level possible, going directly to the celldisk metrics. For that I used CD_IO_BY_R_LG_SEC, CD_IO_BY_R_SM_SEC (for reads), CD_IO_BY_W_LG_SEC, and CD_IO_BY_W_SM_SEC (for writes). Basically, it reports: “The rate which is the number of megabytes read in large blocks per second from a cell disk”.
Filtering just from flash disks type I had this numbers:
CellCLI> list metrichistory where collectionTime > '2019-12-13T15:42:00+01:00' and collectionTime < '2019-12-13T15:43:00+01:00'
and name like 'CD_IO_BY.*SEC.*' and metricobjectname like 'FD_.*' and metricvalue > 0
         CD_IO_BY_R_LG_SEC       FD_00_exastradm01       179 MB/sec      2019-12-13T15:42:03+01:00
         CD_IO_BY_R_LG_SEC       FD_01_exastradm01       296 MB/sec      2019-12-13T15:42:03+01:00
         CD_IO_BY_R_LG_SEC       FD_02_exastradm01       200 MB/sec      2019-12-13T15:42:03+01:00
         CD_IO_BY_R_LG_SEC       FD_03_exastradm01       250 MB/sec      2019-12-13T15:42:03+01:00
         CD_IO_BY_R_SM_SEC       FD_00_exastradm01       3.161 MB/sec    2019-12-13T15:42:03+01:00
         CD_IO_BY_R_SM_SEC       FD_01_exastradm01       3.152 MB/sec    2019-12-13T15:42:03+01:00
         CD_IO_BY_R_SM_SEC       FD_02_exastradm01       2.990 MB/sec    2019-12-13T15:42:03+01:00
         CD_IO_BY_R_SM_SEC       FD_03_exastradm01       3.741 MB/sec    2019-12-13T15:42:03+01:00
         CD_IO_BY_W_LG_SEC       FD_00_exastradm01       0.859 MB/sec    2019-12-13T15:42:03+01:00
         CD_IO_BY_W_LG_SEC       FD_01_exastradm01       1.125 MB/sec    2019-12-13T15:42:03+01:00
         CD_IO_BY_W_LG_SEC       FD_02_exastradm01       1.028 MB/sec    2019-12-13T15:42:03+01:00
         CD_IO_BY_W_LG_SEC       FD_03_exastradm01       0.801 MB/sec    2019-12-13T15:42:03+01:00
         CD_IO_BY_W_SM_SEC       FD_00_exastradm01       0.982 MB/sec    2019-12-13T15:42:03+01:00
         CD_IO_BY_W_SM_SEC       FD_01_exastradm01       0.998 MB/sec    2019-12-13T15:42:03+01:00
         CD_IO_BY_W_SM_SEC       FD_02_exastradm01       1.006 MB/sec    2019-12-13T15:42:03+01:00
         CD_IO_BY_W_SM_SEC       FD_03_exastradm01       0.937 MB/sec    2019-12-13T15:42:03+01:00

CellCLI>
As you can see, just picking up the CD_IO_BY_R_LG_SEC I got around 925 MB/s, a close number from the same that I got from the database metric reading the flash. Another hint from that says to me that reads are requesting more than 128KB for each access since they were counted as large (LG).
FL_IO_DB_BY_W_SEC and FL_IO_FL_BY_W_SEC
Since I was checking for a bad flash report, I checked the flash log metrics but they reported close values from cell disk metrics:
CellCLI> list metrichistory where collectionTime > '2019-12-13T15:42:00+01:00' and collectionTime < '2019-12-13T15:43:00+01:00'
and name like 'FL_IO.*_SEC'
         FL_IO_DB_BY_W_SEC       FLASHLOG        1.974 MB/sec    2019-12-13T15:42:03+01:00
         FL_IO_FL_BY_W_SEC       FLASHLOG        2.673 MB/sec    2019-12-13T15:42:03+01:00

CellCLI>
So, the metrics for disk usage, was OK, reporting correct values.
SIO_IO_RD_FC_SEC
As you can see, the metrics from database usage from flash cache are reporting the same values that were possible to check from the closest as from hardware report (celldisk). So, maybe could be a software misreading in-memory values.
Because of that, I checked from other metrics that can report form features that interact with flash cache. So, I checked from Smart I/O:
CellCLI> list metrichistory where collectionTime > '2019-12-13T15:42:00+01:00' and collectionTime < '2019-12-13T15:43:00+01:00'
and name like 'SIO_.*SEC.*'
         SIO_IO_EL_OF_SEC        SMARTIO         1,223 MB/sec    2019-12-13T15:42:03+01:00
         SIO_IO_OF_RE_SEC        SMARTIO         34.688 MB/sec   2019-12-13T15:42:03+01:00
         SIO_IO_PA_TH_SEC        SMARTIO         0.000 MB/sec    2019-12-13T15:42:03+01:00
         SIO_IO_RD_FC_HD_SEC     SMARTIO         0.174 MB/sec    2019-12-13T15:42:03+01:00
         SIO_IO_RD_FC_SEC        SMARTIO         843 MB/sec      2019-12-13T15:42:03+01:00
         SIO_IO_RD_HD_SEC        SMARTIO         0.101 MB/sec    2019-12-13T15:42:03+01:00
         SIO_IO_RD_RQ_FC_HD_SEC  SMARTIO         0.183 IO/sec    2019-12-13T15:42:03+01:00
         SIO_IO_RD_RQ_FC_SEC     SMARTIO         850 IO/sec      2019-12-13T15:42:03+01:00
         SIO_IO_RD_RQ_HD_SEC     SMARTIO         0.000 IO/sec    2019-12-13T15:42:03+01:00
         SIO_IO_RV_OF_SEC        SMARTIO         3.392 MB/sec    2019-12-13T15:42:03+01:00
         SIO_IO_SI_SV_SEC        SMARTIO         362 MB/sec      2019-12-13T15:42:03+01:00
         SIO_IO_WR_FC_SEC        SMARTIO         0.008 MB/sec    2019-12-13T15:42:03+01:00
         SIO_IO_WR_HD_SEC        SMARTIO         0.000 MB/sec    2019-12-13T15:42:03+01:00
         SIO_IO_WR_RQ_FC_SEC     SMARTIO         0.017 IO/sec    2019-12-13T15:42:03+01:00
         SIO_IO_WR_RQ_HD_SEC     SMARTIO         0.000 IO/sec    2019-12-13T15:42:03+01:00

CellCLI>
And as you can see the SIO_IO_RD_FC_SEC (that means “The number of megabytes per second read from flash cache by smart I/O”) reported almost the same that value (843 MB/s) from the database and cell disk.
The Missing Metric
As you can see above, the metrics close from HW reported almost the same that was reported by DB. And from features usage, almost the same too. To be more clear is that:
So, it is not miss reading from memory since the Smart I/O report correctly. Returning the review for flash cache, all metrics are:
CellCLI> list metrichistory where collectionTime > '2019-12-13T15:42:00+01:00' and collectionTime < '2019-12-13T15:43:00+01:00'
and name like 'FC_IO_BY.*' and metricvalue > 0;
         FC_IO_BYKEEP_W                          FLASHCACHE      519 MB                          2019-12-13T15:42:03+01:00
         FC_IO_BY_DISK_WRITE                     FLASHCACHE      111,626,264 MB                  2019-12-13T15:42:03+01:00
         FC_IO_BY_DISK_WRITE_SEC                 FLASHCACHE      2.052 MB/sec                    2019-12-13T15:42:03+01:00
         FC_IO_BY_R                              FLASHCACHE      1,475,538,050 MB                2019-12-13T15:42:03+01:00
         FC_IO_BY_R_ACTIVE_SECONDARY             FLASHCACHE      1,132,686 MB                    2019-12-13T15:42:03+01:00
         FC_IO_BY_R_ACTIVE_SECONDARY_MISS        FLASHCACHE      237,442 MB                      2019-12-13T15:42:03+01:00
         FC_IO_BY_R_DISK_WRITER                  FLASHCACHE      114,172,096 MB                  2019-12-13T15:42:03+01:00
         FC_IO_BY_R_DISK_WRITER_SEC              FLASHCACHE      2.057 MB/sec                    2019-12-13T15:42:03+01:00
         FC_IO_BY_R_DW                           FLASHCACHE      13,071,021,100 MB               2019-12-13T15:42:03+01:00
         FC_IO_BY_R_MISS                         FLASHCACHE      42,381,380 MB                   2019-12-13T15:42:03+01:00
         FC_IO_BY_R_MISS_DW                      FLASHCACHE      133,613,408 MB                  2019-12-13T15:42:03+01:00
         FC_IO_BY_R_MISS_SEC                     FLASHCACHE      0.438 MB/sec                    2019-12-13T15:42:03+01:00
         FC_IO_BY_R_SEC                          FLASHCACHE      19.343 MB/sec                   2019-12-13T15:42:03+01:00
         FC_IO_BY_R_SKIP                         FLASHCACHE      97,002,568 MB                   2019-12-13T15:42:03+01:00
         FC_IO_BY_W                              FLASHCACHE      1,761,639,940 MB                2019-12-13T15:42:03+01:00
         FC_IO_BY_W_DISK_WRITER                  FLASHCACHE      111,615,088 MB                  2019-12-13T15:42:03+01:00
         FC_IO_BY_W_DISK_WRITER_SEC              FLASHCACHE      2.052 MB/sec                    2019-12-13T15:42:03+01:00
         FC_IO_BY_W_FIRST                        FLASHCACHE      183,171,872 MB                  2019-12-13T15:42:03+01:00
         FC_IO_BY_W_FIRST_SEC                    FLASHCACHE      2.452 MB/sec                    2019-12-13T15:42:03+01:00
         FC_IO_BY_W_OVERWRITE                    FLASHCACHE      1,475,454,720 MB                2019-12-13T15:42:03+01:00
         FC_IO_BY_W_OVERWRITE_SEC                FLASHCACHE      1.346 MB/sec                    2019-12-13T15:42:03+01:00
         FC_IO_BY_W_POPULATE                     FLASHCACHE      103,121,912 MB                  2019-12-13T15:42:03+01:00
         FC_IO_BY_W_POPULATE_SEC                 FLASHCACHE      0.381 MB/sec                    2019-12-13T15:42:03+01:00
         FC_IO_BY_W_SEC                          FLASHCACHE      4.179 MB/sec                    2019-12-13T15:42:03+01:00
         FC_IO_BY_W_SKIP                         FLASHCACHE      1,039,399,810 MB                2019-12-13T15:42:03+01:00
         FC_IO_BY_W_SKIP_LG                      FLASHCACHE      605,535,040 MB                  2019-12-13T15:42:03+01:00
         FC_IO_BY_W_SKIP_LG_SEC                  FLASHCACHE      2.695 MB/sec                    2019-12-13T15:42:03+01:00
         FC_IO_BY_W_SKIP_SEC                     FLASHCACHE      6.589 MB/sec                    2019-12-13T15:42:03+01:00

CellCLI>
As you can above it is not the case for FC_IO_BY_R_SKIP (“The number of megabytes read from disks for I/O requests that bypass flash cache”) and FC_IO_BY_R_MISS_SEC (“The number of megabytes read from disks per second because not all requested data was in flash cache”). And even if we consider some minutes before and after:
CellCLI> list metrichistory where collectionTime > '2019-12-13T15:41:00+01:00' and collectionTime < '2019-12-13T15:44:00+01:00'
and name = 'FC_IO_BY_R_SKIP';
         FC_IO_BY_R_SKIP         FLASHCACHE      97,002,568 MB   2019-12-13T15:41:03+01:00
         FC_IO_BY_R_SKIP         FLASHCACHE      97,002,568 MB   2019-12-13T15:42:03+01:00
         FC_IO_BY_R_SKIP         FLASHCACHE      97,002,568 MB   2019-12-13T15:43:03+01:00

CellCLI> list metrichistory where collectionTime > '2019-12-13T15:41:00+01:00' and collectionTime < '2019-12-13T15:44:00+01:00'
and name = 'FC_IO_BY_W_SKIP';
         FC_IO_BY_W_SKIP         FLASHCACHE      1,039,399,420 MB        2019-12-13T15:41:03+01:00
         FC_IO_BY_W_SKIP         FLASHCACHE      1,039,399,810 MB        2019-12-13T15:42:03+01:00
         FC_IO_BY_W_SKIP         FLASHCACHE      1,039,401,150 MB        2019-12-13T15:43:03+01:00

CellCLI> list metrichistory where collectionTime > '2019-12-13T15:41:00+01:00' and collectionTime < '2019-12-13T15:44:00+01:00'
and name like 'FC_IO_BY_.*_MISS.*SEC' and  metricvalue > 0
         FC_IO_BY_R_MISS_SEC     FLASHCACHE      0.702 MB/sec    2019-12-13T15:41:03+01:00
         FC_IO_BY_R_MISS_SEC     FLASHCACHE      0.438 MB/sec    2019-12-13T15:42:03+01:00
         FC_IO_BY_R_MISS_SEC     FLASHCACHE      0.521 MB/sec    2019-12-13T15:43:03+01:00

CellCLI>
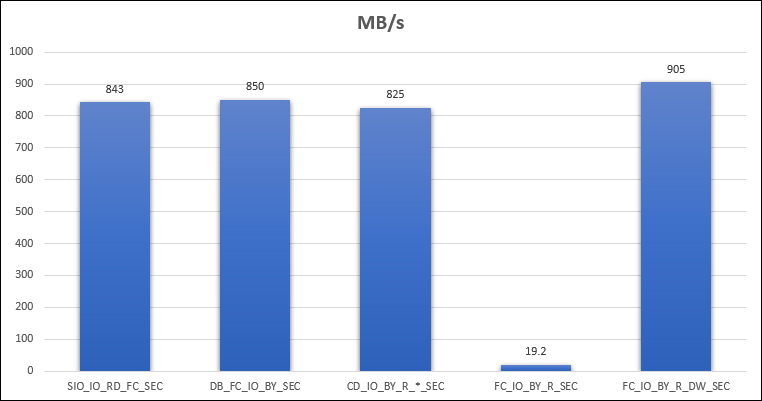
But if we look closely the metrics from FC above, we can see the high value for FC_IO_BY_R_DW (“The number of megabytes of DW data read from flash cache”). And if we check some minutes we can see the usage:
CellCLI> list metrichistory where collectionTime > '2019-12-13T15:41:00+01:00' and collectionTime < '2019-12-13T15:44:00+01:00'
and name = 'FC_IO_BY_R_DW';
         FC_IO_BY_R_DW   FLASHCACHE      13,070,966,800 MB       2019-12-13T15:41:03+01:00
         FC_IO_BY_R_DW   FLASHCACHE      13,071,021,100 MB       2019-12-13T15:42:03+01:00
         FC_IO_BY_R_DW   FLASHCACHE      13,071,055,900 MB       2019-12-13T15:43:03+01:00

CellCLI>
From that, we can see that at 15:41 the usage was 13,070,966,800 MB and at 15:42 the usage was 13,071,021,100 MB. And if we do the diff, between this minute the difference was 54300 MB. And if we divide by each sec we have 54300/60 = 905 MB/s.
So, the missing values were found, the flash cache read usage was counted as DW. But if you followed everything, we wad legitim reads from flash cache that was not counted at FC_IO_BY_R_SEC. So, the missing metric, in this case, it is FC_IO_BY_R_DW_SEC.
Reasons
The reason why the read was counted at FC_IO_BY_R_DW and not by the generic FC_IO_BY_R_SEC is not clear. Maybe because the block size of tablespace for the database is different than 8K, maybe the requests were large (more than 128 KB are we saw in cell disk metric). It is not clear why. Or maybe FC_IO_BY_R_SEC just report what was really read by flash cache from the database. It can occur that documentation is not clear and some details why this behavior occurs need to be clarified.
But we can see that FC_IO_BY_R_SEC doesn’t reflect the current usage in some cases. If you want to verify the FC usage, the metric FC_IO_BY_R_SEC can, sometimes, report wrong values. If the other metrics for FC are correct (like SKIP or MISS) was impossible to check at this point. One option is to check directly at celldisk for flash disk usage to verify if you reached the limits for flash usage or check directly from database usage.
Disclaimer: “The postings on this site are my own and don’t necessarily represent my actual employer positions, strategies or opinions. The information here was edited to be useful for general purpose, specific data and identifications were removed to allow reach the generic audience and to be useful for the community. Post protected by copyright.”