Quick post how to check and identify done for INDEX_BACKUP task in ZDLRA. In one simple way, just to contextualize, INDEX_BACKUP is one task for ZDLRA that (after you input the backup of datafile) generate an index of the blocks and create the virtual backup for you.
Here I will start a new series about ZDLRA with some hints based on my usage experience (practically since the release in 2014). The post from today is just little scratch about ZDLRA internals, I will extend this post in others (and future posts), stay tuned.
INDEX_BACKUP
As told before this task is one of the most important for ZDLRA, but it can take a lot of time to index the backup if the file is huge (a lot of TB’). Think that ZDLRA need to index all the blocks for the file, and for the first level 0 this took some time.
Unfortunately, officially there is no way to check how far you are from the end and how much was already done to create the index. The table that shows you the info for running tasks doesn’t contain this information. Because of that, I created a little SQL that you can use to verify the task and try to discover the percentage of already done.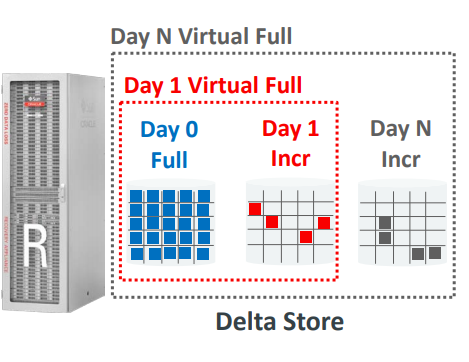
SQL
In the SQL I will use two tables from RASYS ZDLRA schema:
- RA_TASK: The table RA_TASK list the tasks processed/in wait/running. Documented here (https://docs.oracle.com/cd/E88198_01/AMAGD/amagd_views.htm#AMAGD1440)
- SESSION: Internal table for ZDLRA that store all the internal sessions running tasks and other things. This is not a documented table/view.
The SQL:
SELECT s.ba_session_id, s.instance_id, s.sid, s.serial#, s.job_name
       , rt.task_id, rt.DB_KEY, rt.db_unique_name, rt.task_type, rt.state, rt.waiting_on
       , rt.elapsed_seconds
       , gs.module, gs.sql_id, gs.action, gs.event
       , rt.BP_KEY, rt.bs_key, rt.df_key, rt.vb_key
FROM sessions s
JOIN ra_task rt
ON rt.task_id = s.current_task
JOIN gv$session gs
ON gs.inst_id = s.instance_id
AND gs.sid = s.sid
AND gs.serial# = s.serial#
ORDER BY rt.LAST_EXECUTE_TIME DESC
This query is a join between RA_TASK, SESSION (from ZDLRA), and V$SESSION from DB side. As you can see, the link between RA_TASK and SESSION is the current task. And since you reach the SESSION info from ZDLRA, you can link with the sid, serial#, and inst_id running the task. Fortunately, the V$SESSION has the desired information. This query returns all running tasks, you can filter by task type if desired.
Look the result from one execution:
SQL> l
  1  SELECT s.ba_session_id, s.instance_id, s.sid, s.serial#, s.job_name
  2         , rt.task_id, rt.DB_KEY, rt.db_unique_name, rt.task_type, rt.state, rt.waiting_on
  3         , rt.elapsed_seconds
  4         , gs.module, gs.sql_id, gs.action--, gs.event
  5         , rt.BP_KEY, rt.bs_key, rt.df_key, rt.vb_key
  6  FROM sessions s
  7  JOIN ra_task rt
  8  ON rt.task_id = s.current_task
  9  JOIN gv$session gs
 10  ON gs.inst_id = s.instance_id
 11  AND gs.sid = s.sid
 12  AND gs.serial# = s.serial#
 13* ORDER BY rt.LAST_EXECUTE_TIME DESC
SQL> /

BA_SESSION_ID INSTANCE_ID        SID    SERIAL# JOB_NAME             TASK_ID     DB_KEY DB_UNIQUE_NAME TASK_TYPE       STATE   WAITING_ON ELAPSED_SECONDS MODULE         SQL_ID        ACTION                   BP_KEY     BS_KEY     DF_KEY     VB_KEY
------------- ----------- ---------- ---------- ----------------- ---------- ---------- -------------- --------------- ------- ---------- --------------- -------------- ------------- -------------------- ---------- ---------- ---------- ----------
     93729765           2       4453      42235 RA$_EXEC_93730430   93676068     477602 SIMON_DB1      INDEX_BACKUP    RUNNING                 28558.1086 q_restore_fast brt6uuhzacdnu plan 12% done          41032043

SQL>
Columns import here:
- ACTION: from GV$SESSION show the percentage already done for this INDEX_BACKUP task.
- ELAPSED_SECONDS: from RA_TASK, show seconds that this task is running. You can use together with the percentage and try to figure out the time to reach 100%.
- BP_KEY/DF_KEY/BS_KEY/VB_KEY: from RA_TASK, show base info from what is the input to task. In this case, and usually, for INDEX_BACKUP tasks the only column will be BP_KEY (that represent the backup piece key id) because you are indexing a new backup that entered in the ZDLRA.
As you can see, the INDEX_BACKUP task 93676068 for the backup piece 41032043 took 28558 seconds and it is running without a wait and processed 12% of the backup piece. We can dig a little more try to identify and validate some values from blocks processed, but I will cover in the second part.
Conclusion
As you can see, with this simple query you can check the percentage done for the INDEX_BACKUP task. Was needed to query some internal tables of the ZDLRA, but the desired result was easy to find. I tested this query with an old version of ZDLRA (12.2.1.1.1-201805 from August of 2018) and with the last version (12.2.1.1.2-201907 from 11/July) and the result was the same, and always accurate.
I will post and cover more about ZDLRA, from my experience until to internal details.
You can check my presentation at OOW 2015 about my MAA project that used ZDLRA to protect all environment: https://www.oracle.com/technetwork/database/availability/con8830-zdlradeepdive-2811109.pdf and here too: http://www.fernandosimon.com/blog/zdlra-since-2014/
Disclaimer: “The postings on this site are my own and don’t necessarily represent my actual employer positions, strategies or opinions. The information here was edited to be useful for general purpose, specific data and identifications were removed to allow reach the generic audience and to be useful for the community. Post protected by copyright.”
Muito bom
Hi Simon,
I need info on other zdlra task also. Like how purge_df , reconcile task will work internally . Could you please write a blog on other task too.
Thanks in Advance
Thanks
Shubham
Hi,
The idea is almost the same, but for some tasks, it is complicated to check the % of what was done.
So, basically, you check the “ra_task” and link with “session” table to discover which session is executing the task.
With the SID, serial, you can go to “gv$session” and get the “sql_id”. Since most of sql’s use bind variable (inside ZDLRA), you can check at “gv$sql_bind_capture” to check the values used.
If you check the same task (in repeating way), you will notice that usually, one value is increasing, and one is fixed. The fixed usually is the size/block of that backupset that the task is working, and the value that is increasing is the current block.
With that, you can discover who much work was done by the task, and how much is needed until complete the task.
Unfortunately, not all tasks have this or are easy to read.
One post with more info about that is in place, but need to finish more details before release it.