It is well known that Exadata delivers a lot of power for databases and, besides that, has a lot of features that can be combined to reach the desired goals. But you need to understand how to use Exadata, it is not just knowing the internal hardware pieces, put some SQL hints, or use smart scan that makes a better DBA (or DMA).
Think about the “traditional” environment (DB + storage) and how you check for performance problems there. Basically, you just have/receive the number of IOPS from luns, throughput in MB/s, and latency from the storage side. But Exadata provides a lot of metrics that go beyond that and can be used to really understand what it is happening between the database and the access of data blocks.
For me, one of the most underrated (and not even well explained in web) features of Exadata is the metrics because they can help you to really understand Exadata deeply. As an example, from metrics, you can check the MB/s read from flash cache, disks (per type), flash log writes, reads that bypassed flash cache and went to disk, Smart I/O per database, PDB or consumer groups. It is not part of this post explain all the metrics (will be in another one), but you can read more at Chapter 6 of the Exadata User Guide.
In this post, I will show you one example of how to use the metric to identify and solve database problems. Sometimes it can be a hide and seek game, but I will try to show you how to use metrics and how they can help you on your daily basis.
DB_FC_IO_BY_SEC
Some weeks ago I was extending one script that I created 5 years ago to read metrics from all Exadata storage cells and saw interesting behavior for one database that can be a good example. The script can be checked in my post at Oracle OTN (Portuguese Version, Spanish Version, unfortunately, there is no English version. Was sent to be published, but never was – I don’t know why), the version published read all metrics and output it in one line. You can use it to insert it into one database or save it in one file as you desire.
The behavior that I saw was related to the values reported by DB_FC_IO_BY_SEC that represent the “The number of megabytes of I/O per second for this database to flash cache” done per database. The image below reports the GB/s read from DB_FC_IO_BY_SEC for just one database in two consecutive days, each point in the graph represent the average value from the last 10 minutes (read minute by minute).
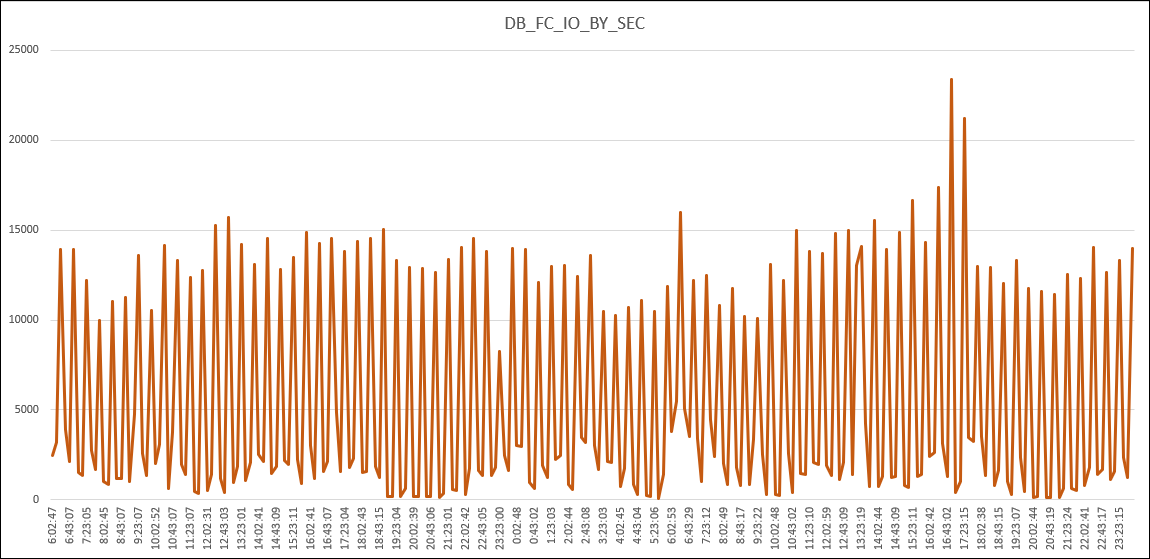
Check some values:
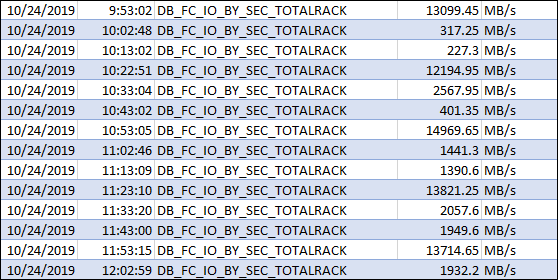
As you can see, there are peaks of values, but in the end, as you can imagine, it does not appear to be correct. This does not appear to be/represent a normal trend/pattern and intuitively this got me attention. And ss you can see below, the activity report from EM/CC (for one/same day than above) for this database does not report the same behavior or even a hint:
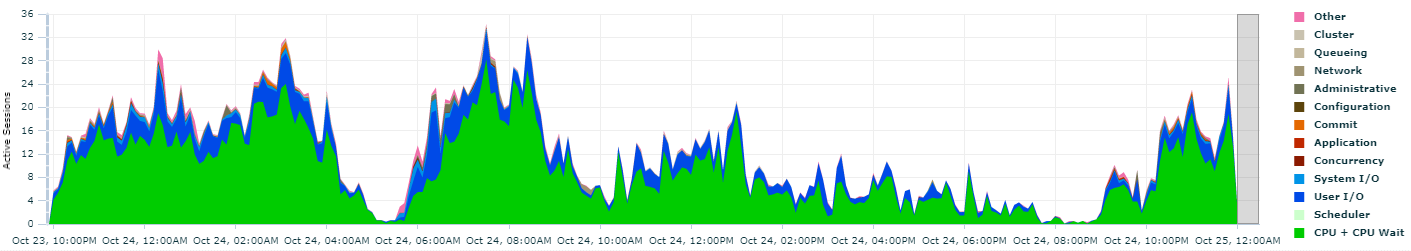
Understand, or know Exadata, it is more than put database running there and forgot it. Even a normal/expected report from the default monitoring tools (EM/CC) of the database side can hide bad things. This can be worst in Exadata because you have a lot of power available. Using metrics, you can find these gaps and provide a better result about database tune, or discover and solve problems.
Remember above the metric values for DB_FC_IO_BY_SEC, they have a max peak (in the image) at 25GB/s. And if you check at Exadata X8 Data Sheet, the max value from flash read per server (not EF) is around 21GB/s. Since the values that I showed before are the sum for all cells (Half Rack here), they really bellow the maximum that Exadata can reach. The database was not struggling in Exadata (I imagine that will be in the traditional environment), but the power available at Exadata (and flash cache feature) was hiding the problem.
Returning to the example, since the report hinted some bad usage I made research from running SQL’s and hit two notes:
- Slow Performance Of DBA_AUDIT_SESSION Query From “Failed logins” Metric in Enterprise Manager (Doc ID 1178736.1).
- EM 12c, 11g: High Cpu Utilization from Enterprise Manger Agent perl Process Running failedLogin.pl for audit_failed_logins metric (Doc ID 1265699.1).
Basically, the EM/CC collection for failed login attempts was running and consuming a lot of resources. And since this EM/CC audit was not needed, it was can be disabled and after that, the DB_FC_IO_BY_SEC changed to:
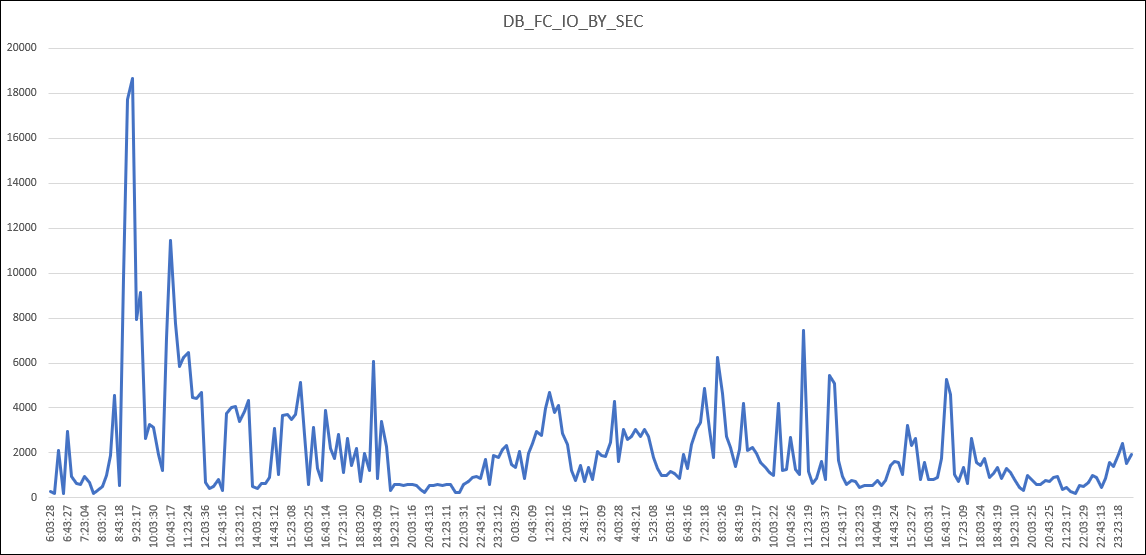
As you can see, more normal behavior for database usage.
The Point
The point of this article is clear. Exadata can be simple to use, you just drop the database there and the features available will help. But unfortunately, the extra power that you have there can hide the bad things (as shown above). If you compare how to do the same in the traditional environment, the only details from the storage side that you can discover are just IOPS and throughput. But for Exadata, you can read a lot of other points to tune the database or show you problems.
Understand Exadata it is more than just learn about network, hardware, or put some hints to have a better performance. Remember that hardware change every release, and the database optimizer every version too. But Exadata metrics are there since the beginning and they just expand to provide a complete view about what happens between the database and the hardware itself. Know how to read and interpret it is the key to a good DMA.
I really recommend read Chapter 6 of the Exadata User Guide. But it is important too to have a good base about what Exadata HW can deliver and how the features work. The Exadata X8 Data Sheet, Technical White Paper and MAA OOW presentations provide you a good source of information.
Remember, it is more than learning about hardware or use some hints for SQL. It is more about understanding how hardware and software are integrated and what you can extract from there. And with Exadata metrics, you can really discover what is happening.
Disclaimer: “The postings on this site are my own and don’t necessarily represent my actual employer positions, strategies or opinions. The information here was edited to be useful for general purpose, specific data and identifications were removed to allow reach the generic audience and to be useful for the community. Post protected by copyright.”
Pingback: Exadata, Understanding Metrics | Fernando Simon